

 The Nevada Independent2 followersVerified
 Stay connected and personalize your Newswire experience.
The early voting blog, 2026 general
- Publisher
- The Nevada Independent
- Topic
- Elections
- Location
- Local Net, Nevada, US
- Published
- Oct 6, 2026 · 3:32 PM
Las Vegas Newswire preserves the publisher's attribution and original-source link while adding publisher, topic and related-coverage navigation for readers.

UPDATED, 10/18/26. 8 AM
Welcome to Game Day! Yes, it's a k a Day Two of in-person early voting.
First, let me show you where we stand as some ballots came in late. I have decided to show you all of the bellota, including the ones returned but not accepted – 90 percent-plus of those will be accepted, so:
Democrats: 36,264, 39.5 percent
Republicans: 31,760, 34.6 percent
Nonpartisan and others: 23,893, 26.0 percent
Total: 91,917 (8 percent of total turnout I expect)
Ds plus 4,504, or 4.9 percent
If we just use accepted mail, the Dem lead is 5.2 percentage points, so not much difference.
I want to keep emphasizing that one day does not a trend make. But what we need to watch is if the Dems continue to build on this lead or it slowly erodes by Election Day and how much each party may be cannibalizing it's Nov. 3 vote. Republicans crushed the Dems by nearly 50K ballots on Election Day in 2024 but it was about even in the last midterm (2022).
A more detiled breakdown:
Clark is only 64 percent of the turnout so far -- it usually gets closer to 70 percent but turnout in Southern Nevada is never great compared to other counties. Washoe is at 21 percent, punching above its wieght and Dems are strong there while the ruruals also are a few points above registration at 15 percent.
Let me show you what the numbers were like after the first weekend during the last midterm – from my 2022 early voting blog:
Clark early vote Sunday:
Total: 7,861
D – 2,950 (37.5 percent)
R – 3,437 (43.7 percent)
O – 1,474 (18.8 percent)
Clark cumulative early vote:
Total: 19,257
D – 7,171 (37.2 percent)
R – 8,591 (44.6 percent)
O – 3,495 (18.1 percent)
So the raw R lead is about 1,400 votes. The Rs ended up winning early voting in Clark County in 2020 after losing the first two days by smaller margins than they have in past cycles. The final in-person early vote margin was 30,000 votes for the GOP, or about 7 percent. That is, about what it is today in percentage terms.
Clark mail:
Total: 38,789
D—19.005 (49 percent)
R – 9,948 (26 percent)
O – 9,836 (26 percent)
So Dems have a nearly 2-to-1 lead in mail and a raw vote advantage of more than 9,000 votes. As GOP operative Jeremy Hughes points out in his weekly data dive, that 23 percent lead is significantly lower than the 38 percent lead the Dems had in 2020 after the first data dump. But we still don't know what the counting pace is or what the ultimate mail volume will be.
It will be interesting watch the mail margin – not sure they will process any on a Sunday – and how the in-person shapes up today.
I will be at the Bills game and try to check occasionally and post on Twitter, but it will depend on how the game is going and I will certainly do a post tonight.
UPDATED, 10/17/26, 9 PM
Welcome, blog mates!
My last update for the day:
Democrats: 31,767, 39 percent
Republicans: 29,007, 35 percent
Nonpartisan and others: 21,328, 26 percent
Total: 82,102 (7.5 percent of total turnout I expect)
Ds plus 2,760
Here's the breakdown:

So:
Dems lead by 3.4 points statewide
Dems lead mail by 5 point while Rs lead in-person by 1.3 points
Dems won urban Nevada while the rurals came in landslides for the GOP.
The regional breakdowns so far:

Clark in-person turnout was about 3,500 more voters than 2022 and Dems won by 6 points (43-37) where they had lost by 8 points on the first day in 2022, a 14-point turnaround.
Dems lead by 11 points in mail in Clark, which they won by 2-to-1 overall in 2022, so Repubs are probably OK with that number, although it was more than a quarter less than that when the day begun.
I don't want to read much into this after one day, and I really don't like the day-to-day-in-another-cycle comparisons, but I think Dems will be pretty satisfied tonight.
Here's the gov race model:

So don't read much into anything yet, and don't forget, as Scarlett said, tomorrow is another day! But it's also the Bills-Raiders game, so don't expect as much from me here, maybe on Twitter. GO BILLS!
UPDATED, 10/17/26, 3:30 PM
Hello, all my friends (and all the haters, too!).
The latest:

So:
Democrats: 25,865, 37 percent
Republicans: 24,826, 36 percent
Nonpartisan and others: 18,554, 27 percent
Total: 69,245 (About 6 percent of what I think turnout will be.)
It's close. I don't want to engage in the parlor game of what first day comparisons mean – Clark turnout is about to pass first-day of 2022, though. But the mix is very different this cycle with Dems barely leading mail and Repubs slightly leading in-person because of the rurals.
It's D +1,039 ballots statewide when I took tjat snapshot.
Here's a more fun parlor game: I have modeled what the current governor's race numbers might be with different assumptions, all of which can be changed as numbers come in. My assumptions are that each party gets 90 percent loyalty (please don't whine, it's an easy starting point) and then various indie split scenarios, with 5 percent going elsewhere.
Here's a snapshot in time:

More to come...
UPDATED, 10/17/26, 7:45 AM
Good morning, blog mates!
Today is the day – in-person early voting begins! (Don't forget the SOS dashboard is tracking mail and in-person in real time, or a reasonable facsimile thereof.)
Here's where we start the day:
D 16,492 (37 percent)
R 14,939 (34 percent)
O 12,623 (29 percent)
T 44,054 (That is about 4 percent of what I expect the turnout to be.)
D lead statewide is 1,553 ballots.
History: In 2022, there were few mail ballots in Clark at this point and early voting, Day One, was 11,396 and Rs won it by 8 percentage points in Clark.. (Corrected from original that said Ds won.)
Trends may begin to emerge today, but it's the overall mix of mail and in-person early voting and the numbers that I'll be watching more closely.
History:
In 2022, in-person was 28 percent of overall turnout, and Rs won by 50,000 ballots, 49 percent to 31 percent. Big rural turnout helped a lot – the Clark edge was 23,000 and Washoe was 8,000.
Mail was 51 percent of the total turnout and Dems won by 70,000 ballots or 14 percent.
In 2024, not a midterm and where turnout was much higher, those numbers were:
In-person early voting (36 percent of overall vote): Rs plus 97,000, or 18 percent. Mail (47 percent of overall vote) : Ds plus 66,000, or 9 percent.
I will be keeping an eye on the gaps in mail and in-person as well as the volume to try to gauge what's happening. Remember, though, it's much more difficult when non-major-party voters may get to be close to 30 percent of the turnout.
One other thing:
I'll also be tracking the percentage of the vote from each area. Voter reg:
Clark: 72 percent
Washoe: 16 percent
Rurals: 12 percent
Turnout so far:
Clark: 64 percent
Washoe: 24 percent
Rurals: 12 percent
Let the votes roll in….
UPDATED, 10/16/26. 1:30 PM
Hello, my loyal blog mates!
The moment you have been waiting for has arrived – or almost! In-person early voting starts tomorrow, so it's time to get down to serious business.
I am going to try to be consistent on how I start the longer update posts with the most salient information at top, with this format (current snapshot below):
Ballots cast breakdown with percentages
D 15,765 (38 percent)
R 13,944 (33 percent)
O 11,993 (29 percent)
T 41,702
Then, turnout by county. Then, how much each area – Clark, Washoe and rurals are contributing to the turnout. (Too early for those, but they will start this weekend.)
(I am trying not to present TOO MUCH granular data – I can save that for my analysis. Let me know if you like this or what more you want to see up top.).
I will also give a few analytical headlines for those who – sniff, sniff – don't want to read the whole post. (i.e. "Rs looking even stronger in Clark" or "Ds crushing it in Washoe") I will post my model – the first one is below – with the caveat that it is dynamic and you will see there are columns for me to adjust scenarios based on actual turnout.
My initial projection (I used AI to help look at past performance and analyze what this year might bring) is that turnout will be about 1.14 million voters, or about 55 percent of active voters. It may be slightly higher, but let's start there. (Reminder: In 2018, turnout was 62 percent and in 2022 it was 55 percent.)
Republicans almost always have a turnout edge, and my model shows an R+3 electorate – 39-36, with others getting the remaining quarter of the vote. You can see all of that in the model. If it looks blue wavy, I will adjust. Feel free to tell me what your model says!
A few things to remember: Since 2020 and the COVID era, mail ballots have greatly increased as a method of voting (ablut half now) and Election Day generally has a small percentage of the vote, a fifth or less:
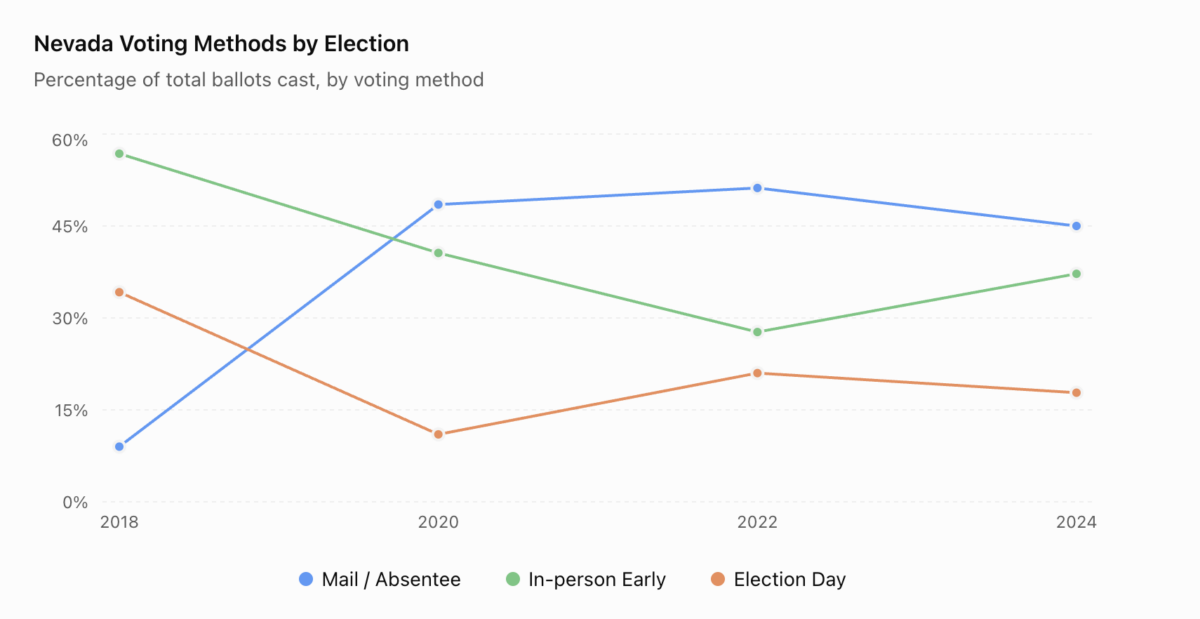
Here's how it breaks down by party:
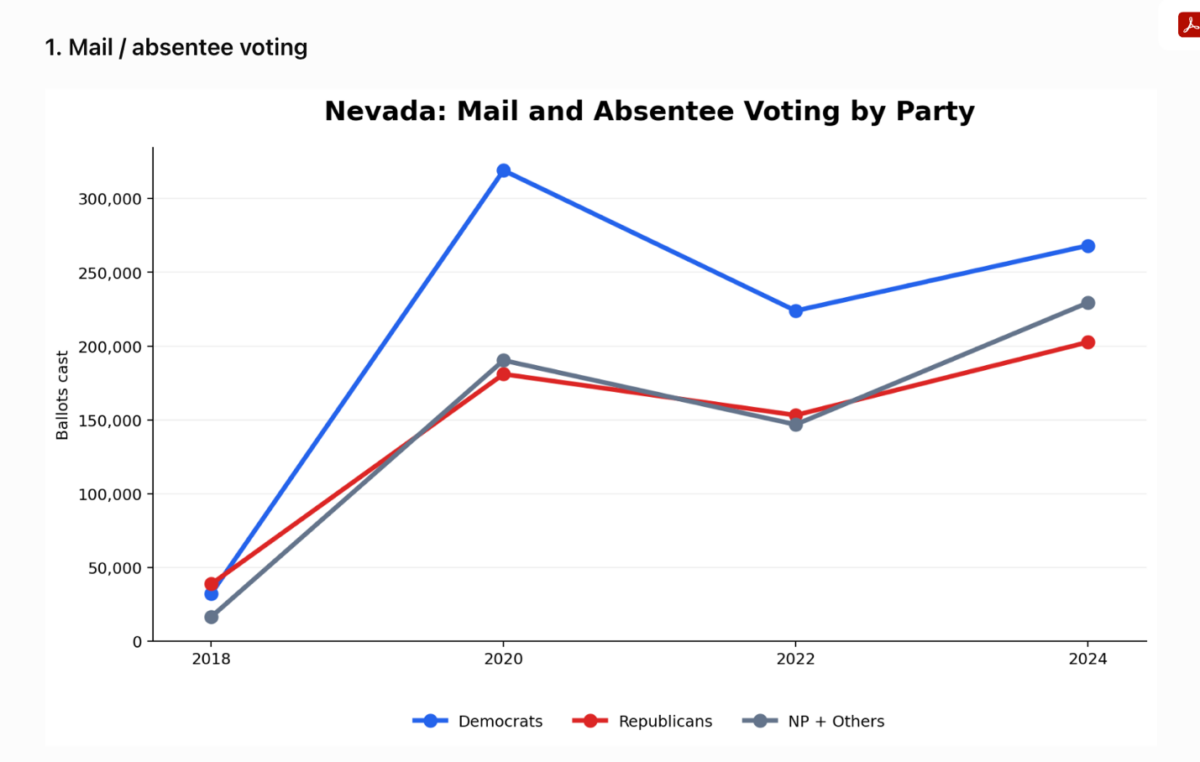
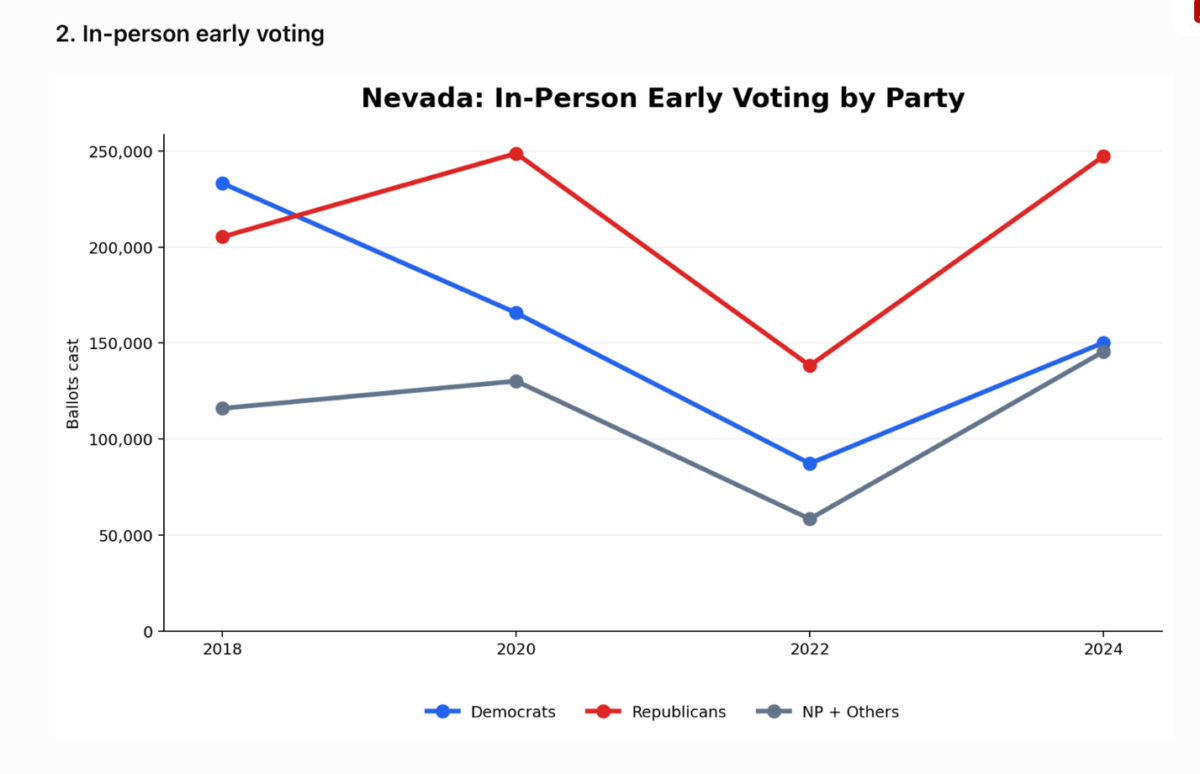
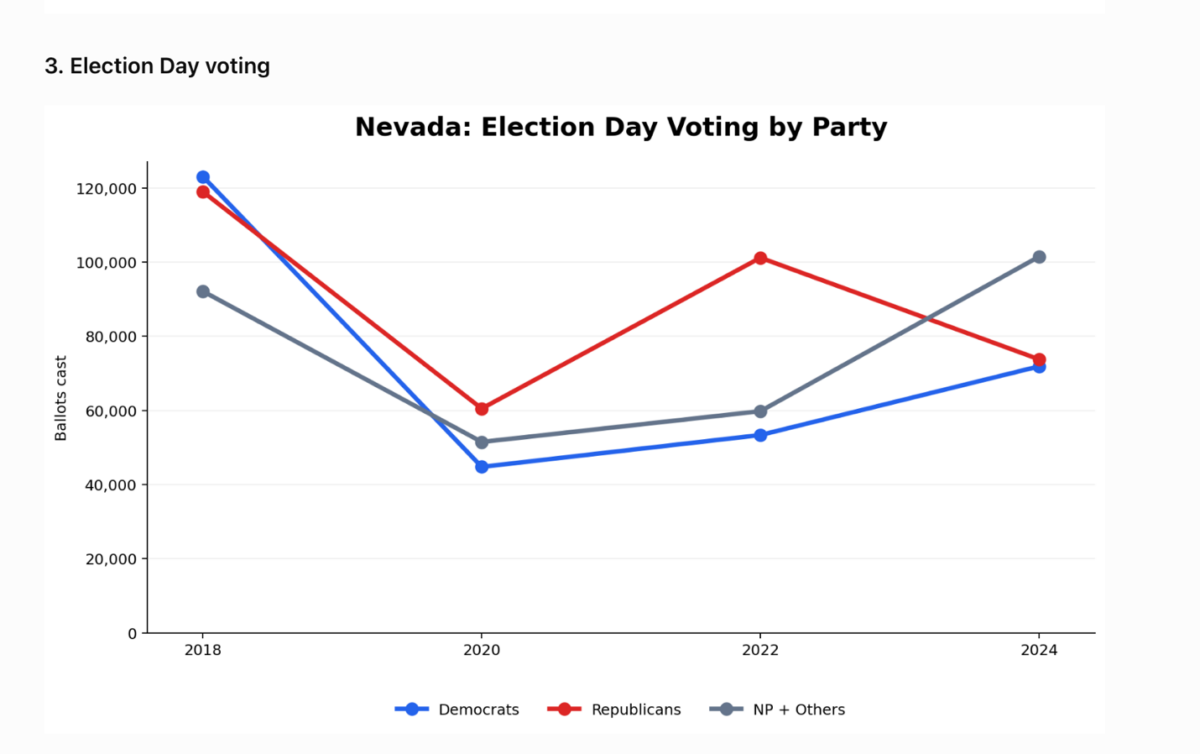
So if past is prologue, 80 percent to 85 percent of the vote will be in before Nov. 3. We will know a lot.
WHAT TO LOOK FOR ON THE FIRST DAY OF IN-PERSON EARLY VOTING
Clark will always be most important. I love Washoe and the rurals, but Clark is where the votes are and drives the rest of the state. In 2022:
11,396 turned out the first day
This was the breakdown:
D – 4,221 (37 percent)
R –5,154 (45 percent)
O – 2,021 (18 percent)
So Rs had an 8-percentage-point lead after the first day. in Clark. I don't love these comparisons because every midterm is different, and this one could be very different. I make only one initial prediction and that is that turnout will be higher than 2022 on the first day in Clark, maybe by a lot. If not, enthusiasm may not be as high as I project.
One more chart before I unveil my model, historical turnout by region:
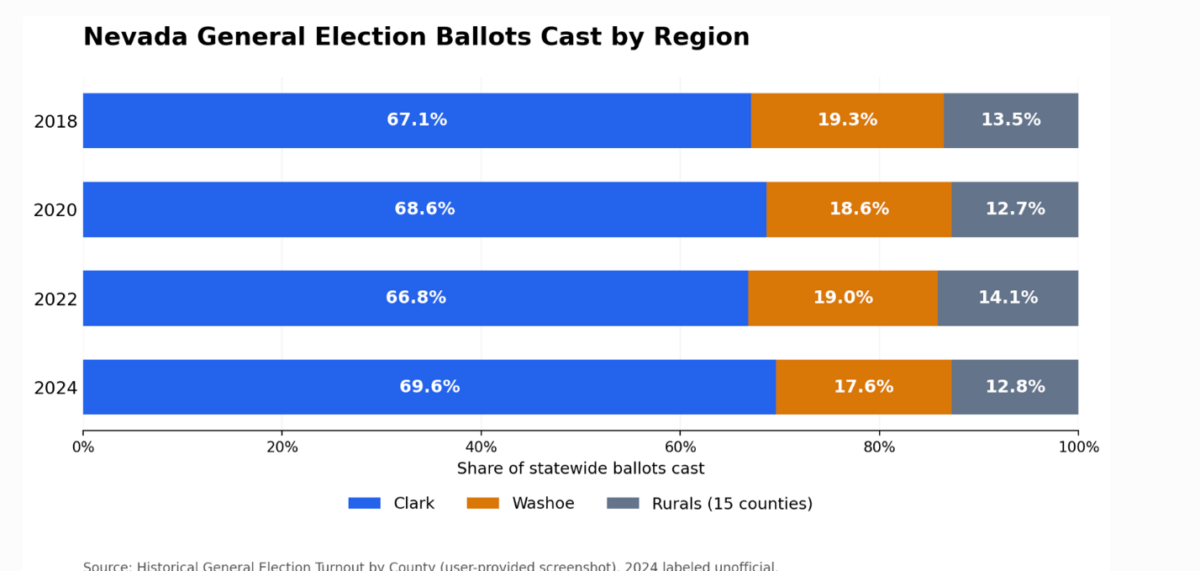
Not a lot of change cycle to cycle, but enough to make a difference in close races. Clark and rurual numbers usually the ones to watch, but if Washoe gets higher than normal, that could be the canary in the coal mine for a bad year for Republicans, including in CD2. If not, then I think the seat gets Flippoed, not flipped.
OK, this post is getting long, so here's the model:

Lemme know what you think. Until I blog again….
UPDATED, 10/16/26, 10:30 AM
Hello, fellow data nerds! (I apologize for being remiss until now with my cheery greetings!)
Some tech glitches with the state file and will have more detail soon, but good news is that the SOS dashboard is now live for mail, in-person early voting and Election Day.
Give you a snapshot for now:
32,213 mail ballots accepted:
12,138 D 38 percent
10,752 R 33 percent
9,323 The rest 29 percent
This is still a very small number, less than 2 percent of active voters. So try to ignore all the breathless tweeters who are making pronouncements on Twitter. You know who you are.
I'll send more detail soon on the eve of early voting, when I think the first day will produce a very large turnout and may give us the first glimpse of any trend. Then I may allow -- even make myself! -- breathless pronouncements. I will also give you a preview with historical trends, the first glimpse of my dynamic model and more.
Are you not excited?
Coming soon…
UPDATED, 10/15/26, 5 PM
The latest SOS ballot total doubled the previous one, now at 30,000 ballots, or almost 1.5 percent of active voters. That's probably up to 2.5 percent of what I project turnout will be, give or take.
The latest:
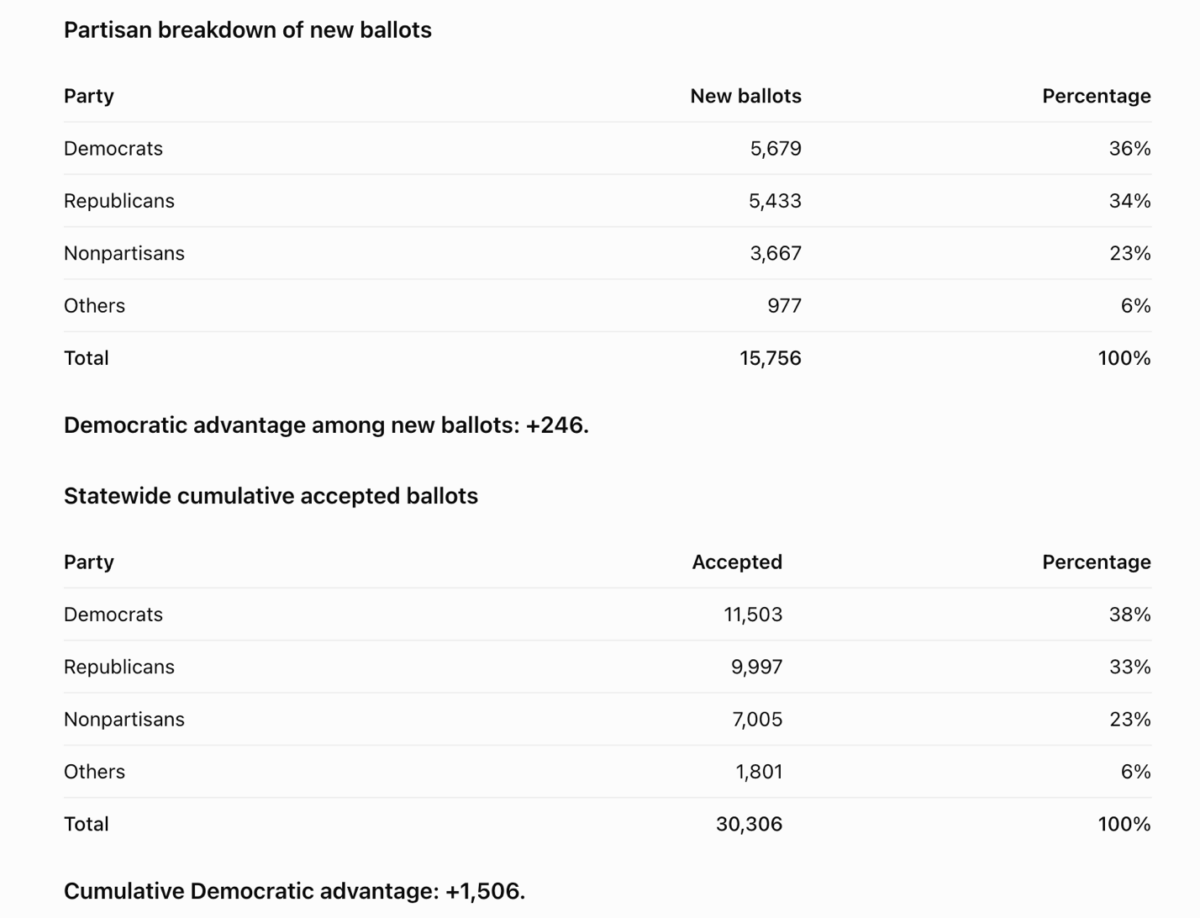
In the congressional districts, the Dems have significant leads (7 percentage points plus) in three of the four, and they are only a percentage point behind in CD2:
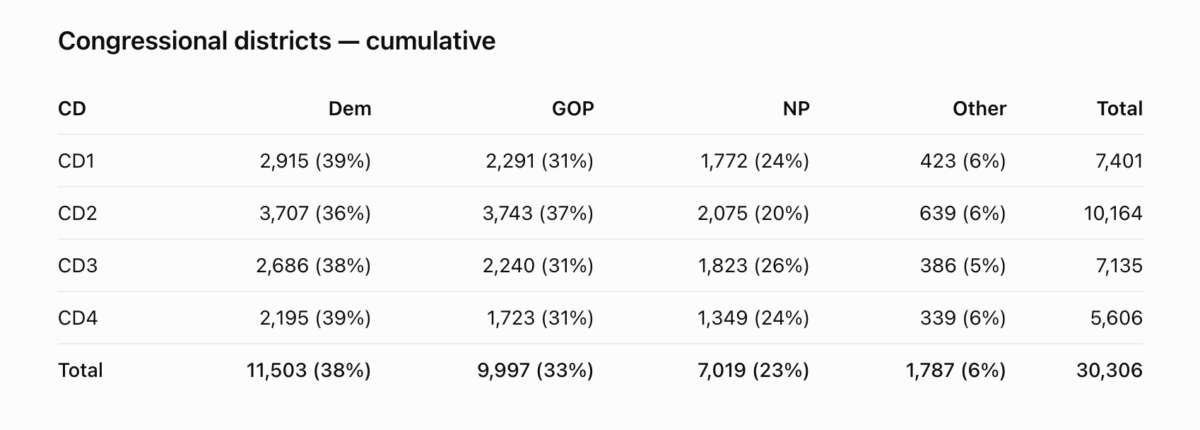
In CD2, Washoe is now up to 73 percent of the ballots, which is about what TBT would need it to be to have a chance to pull off one of the biggest upsets in state annals. Dems have an 8 percentage point lead over Rs in Washoe:

These numbers should give Dems some hope in CD2, although I repeat: IT IS VERY EARLY.
On the other hand, the Clark numbers don't look so bad for the Repubs, so there is something for them to be happy about, although – wait for it! – IT IS VERY EARLY. The counties:

Bottom line: Once early voting starts and we have numbers Saturday and Sunday, we will see a lot more ballots and be able to see if these are patterns or just early blips. It could be either, frankly..
But because of this strange year, with so many folks fearing some kind of election interference, we may see very different voting patterns than in the last two cycles and comparisons may not be so useful. Mail has been half the votes in the last two cycles, but will it be this time? We will know more when we see how big in-person early voting is, starting Saturday.
Starting tomorrow, I hope to give yoi a chart-heavy post with the first glimpse of my model, whcih I can adjust as votes come in, as well as historical data to keep an eye on as we move forward in the two-week in-person voting period.
Watch this space, email me if you want…
UPDATED, 10/15/26, 9:30 AM
About 700 new ballots in latest state file, and the breakdown is:
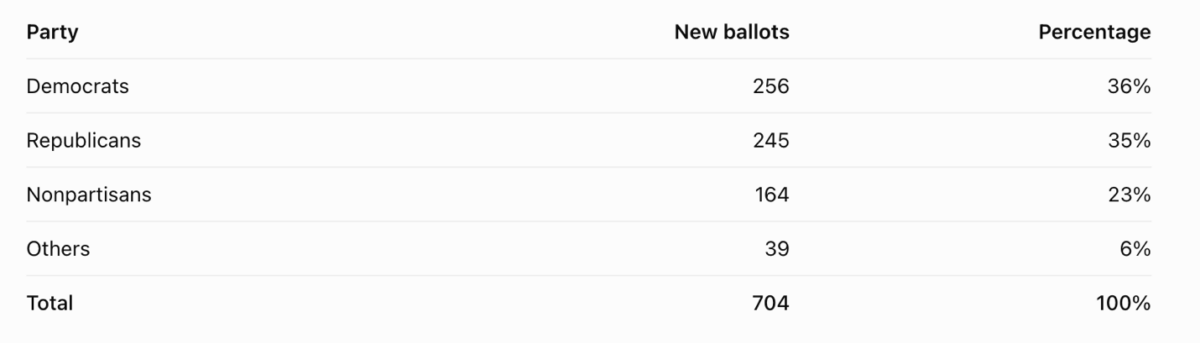
This didn't change much – Dems still with 9 percentage point lead among 14,500 ballots, but still very small number of ballots coming in, less than 1 percent of active voters. Democrats lead Republicans by 1,260 ballots statewide, an increase of just 11.
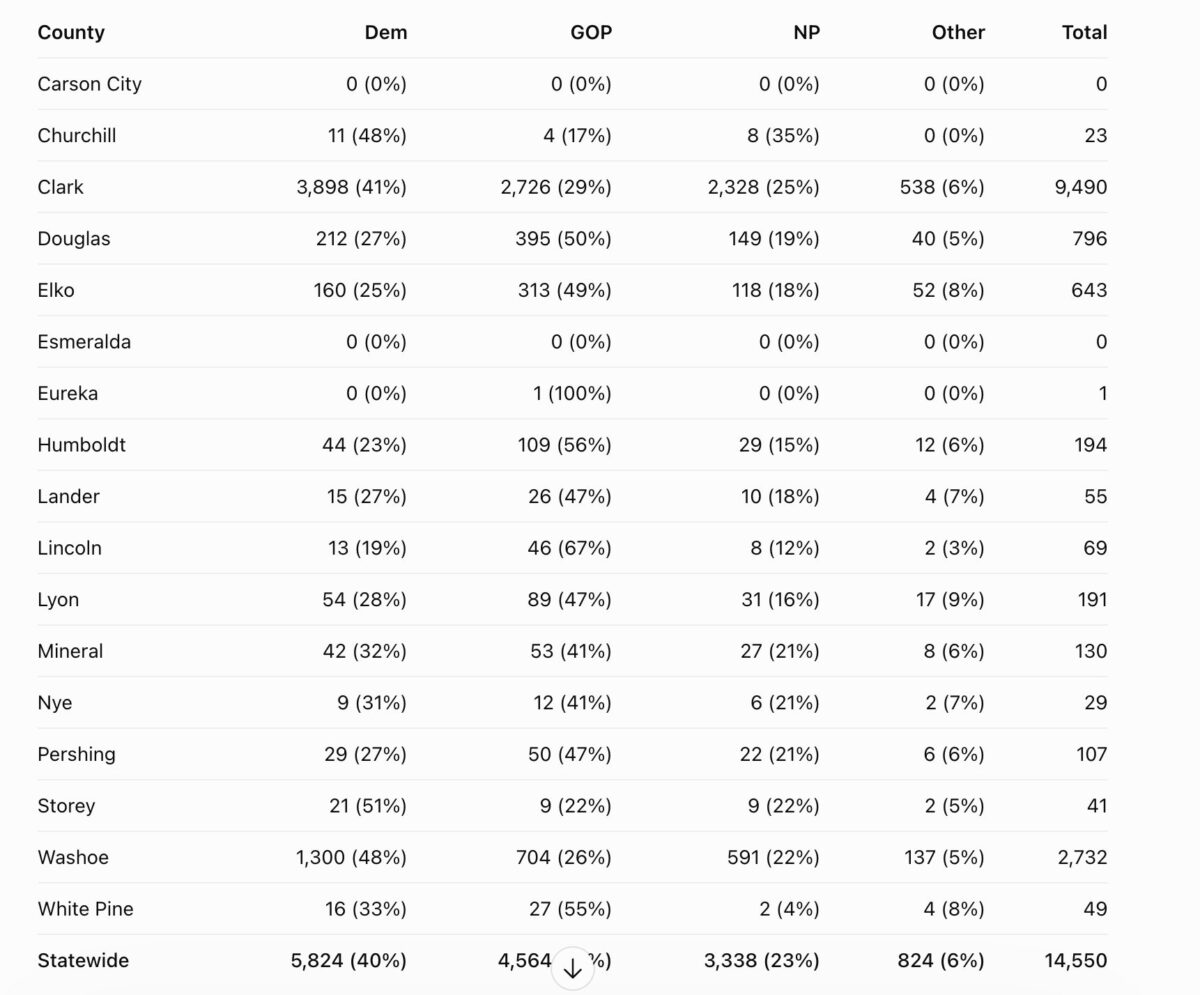
In CD2, the Dems continue to have a slight lead, which is very unlikely to continue as rurals start to come in. Keep an eye on Lyon and Elko counties for rural turnout here and elsewhere.
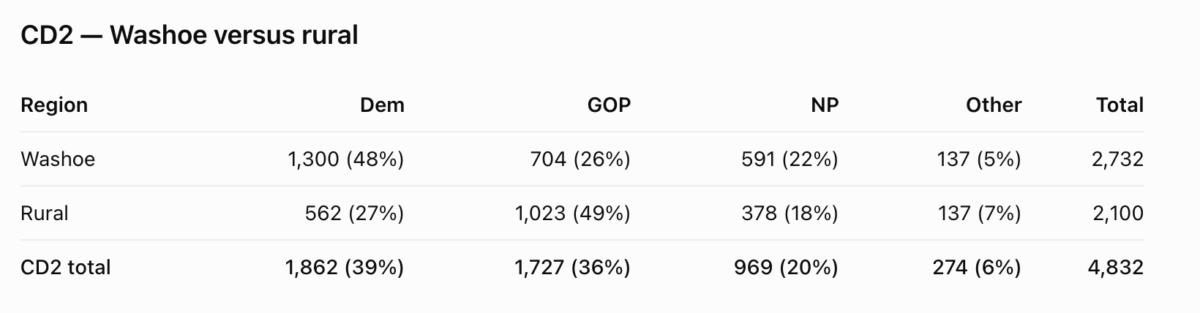
More when I have it, and an early voting preview tomorrow…
UPDATED, 10/14/26, 5 PM
First sizable batch of ballots added to state file this afternoon, more than doubling what we saw before. More than 7,300 new ballots, total is nearly 14,000 accepted.
Let me show you:
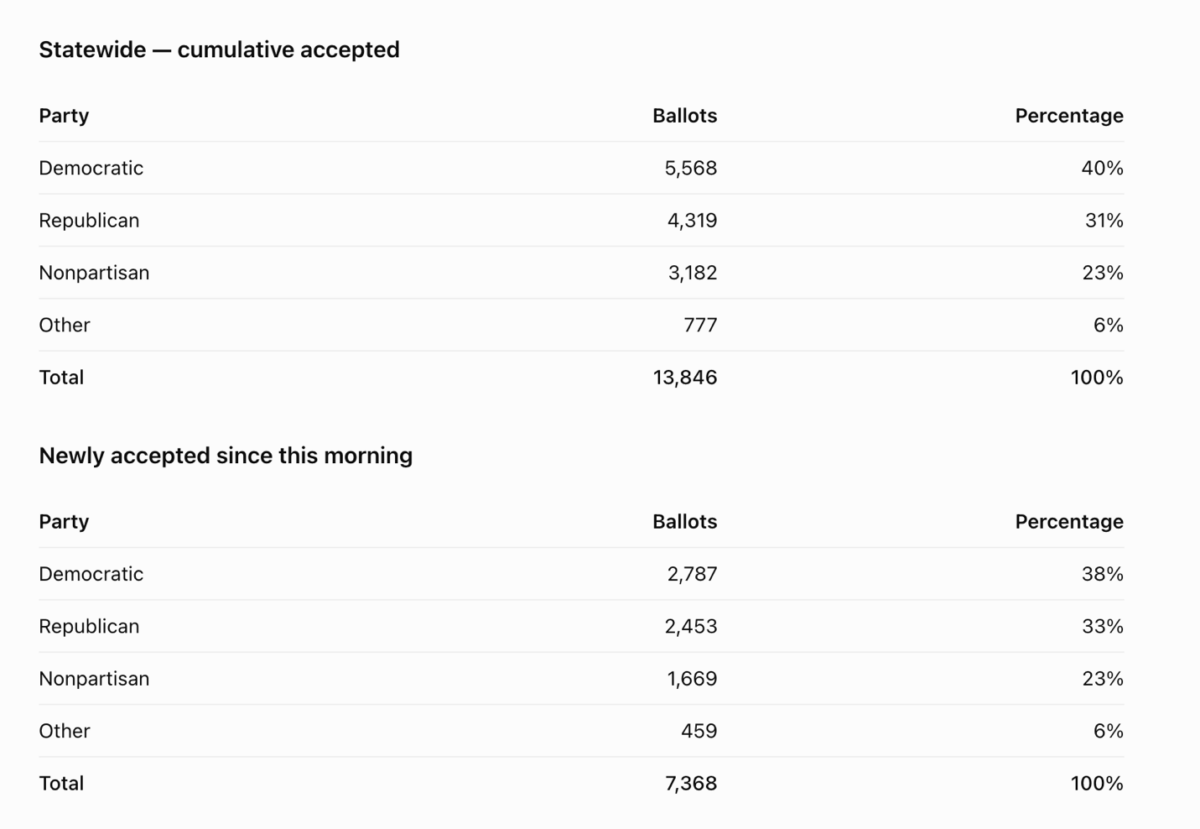
Clark has 75 percent of the new ballots and the Repubs were only 400 ballots behind out of more than 5,500 ballots added to the file. Overall, Dems have a 12 percentage point lead in Clark right now. The numbers:


Look at those Washoe numbers: The Dems are doing very well in Nevada's swing county, where Dem statewide candidates have run well during recent cycles.
The latest from CD2:
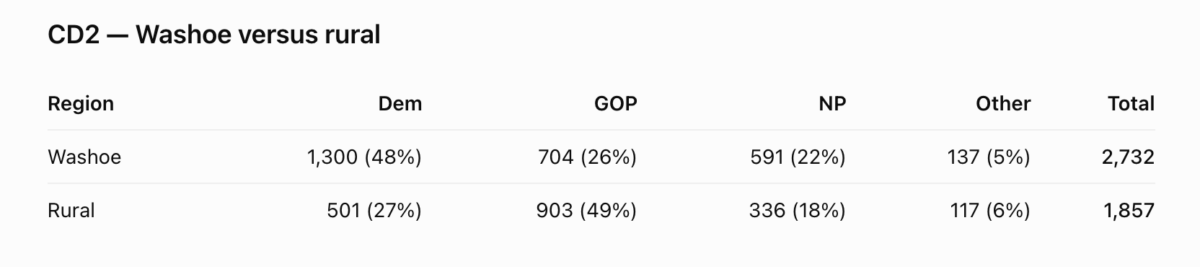
Washoe now represents 60 percent of accepted CD2 ballots. Of the 1,741 new ones, 1,089 came from Washoe and 652 from rural counties.
Remember, the higher percentage from Washoe, the better chance TBT has to win. The math is still difficult, but I think it needs to be at least 5 percentage points higher than it is now unless Flippo is hemorrhaging in the rurals (possible).
So what does this all mean? Some thoughts:
--Almost 14,000 ballots is still only about .7 percent of active voters, but likely to be a little more than 1 percent of total turnout. (Turnout was 55 percent in 2022 and 62 percent in 2018.) If it's 60 percent this cycle, that means about 1.3 million voters, so 14,000 would be 1.2 percent. Still not a lot, but we are getting there, slowly but surely.
--The Dems have about a 1,200-ballot lead statewide, which is 9 percent. If that stays there, it's very significant. But if the Clark numbers are tight, that could change. Clark is now 65 percent of the vote; that's about 7 percentage points below the number of active registered voters. Still a long way to go.
It's way too early to draw any conclusions, as I keep saying. But we are starting to get sizable batches of ballots, we may see some trends soon – and certainly by Saturday when in-person early voting begins.
What am I missing? Send me your thoughts!
UPDATED, 10/14/26, 12:20 PM
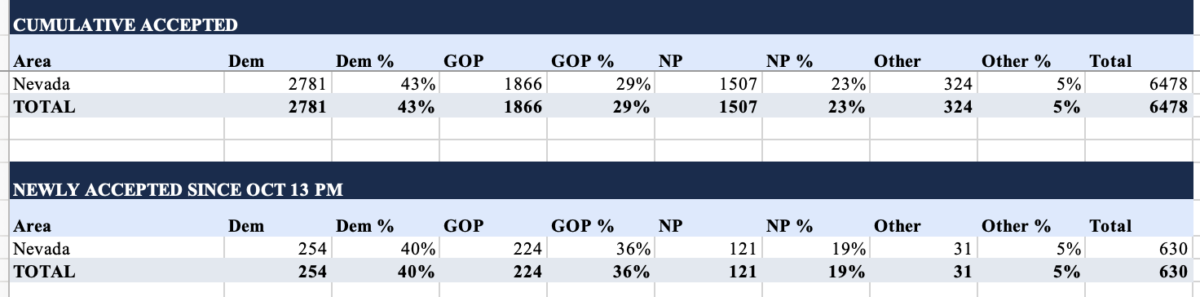
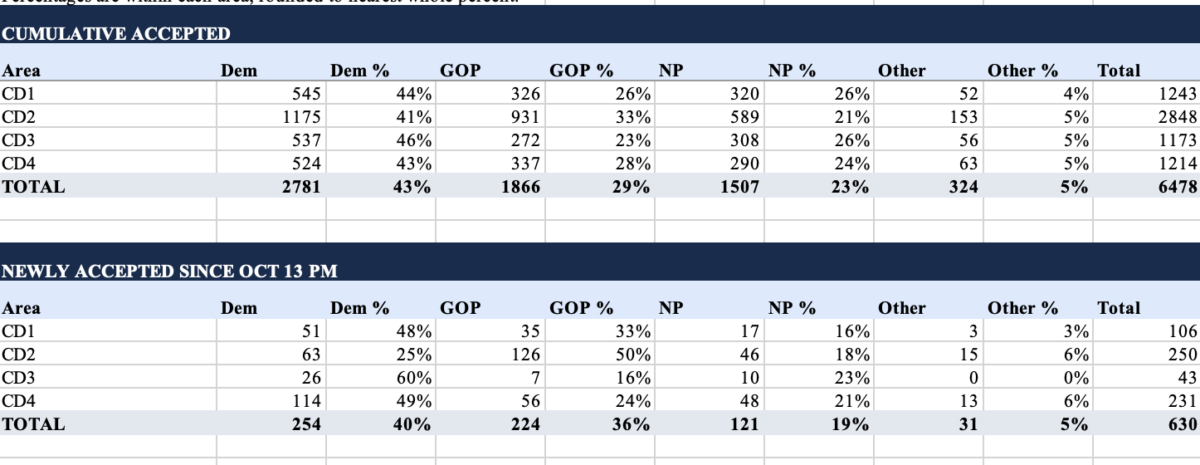
The latest statewide SOS file shows 630 new ballots, which doesn't change a lot. Total is now 6,478 accepted ballots and just under 3,500 are from Clark.
First all of the charts, then some analysis besides IT'S STILL VERY EARLY:
Statewide:
CDs:
Counties:

CD2 breakdown:
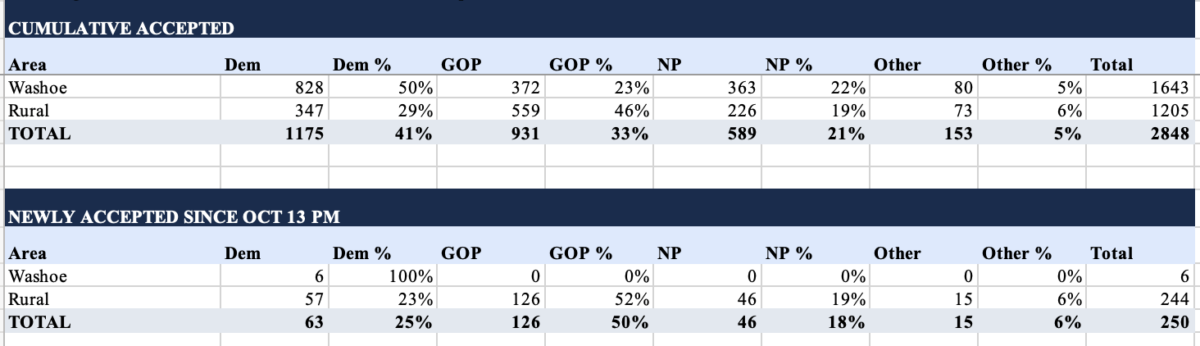
So, we are still at about .3 percent of active voters and probably at about .6 or .7 percent of those who will turn out. Folks, despite what you may see on Twitter, there are no trends yet. These are just super-early voters who want to be done with it already; some days, I wish I could join them!
Washoe has fallen to under 60 percent of the overall CD2 returned and accepted ballots (Democrats scream in panic)! but the Dems still have an 8 percentage point lead right now (Democrats declare victory!). You can see why these numbers don't tell us much yet.
I don't think we will know a lot until this weekend and even then we may not be able to draw any preliminary conclusions.
More data when I have it. You know where to find me.
UPDATED, 10/14/26, 6:50 AM
Just a quick one as i wait for a larger state update this morning, but Doc Samuelson has a Clark update and I downloaded the file and found similar numbers. Professor McDonald has statewide numbers, too, and mine also are close to what he has. Note throughout the process, you may see slightly different numbers from people tracking this stuff -- it all depends when they downloaded the file and looked at ballots that have been accepted.
The bottom line is that there are just under 7,000 ballots in statewide (still not at 1 percent of what we will see in toto( and about 3,000 in from Clark, with Dems ahead by about 15 percentage points. (I don't think any comparisons to past cycles are very useful yet.)
More later. with charts after a busy morning of running around...
UPDATED, 10/13/26, 4:15 PM
About 900 ballots added to state file in latest update, pushing the number of ballots accepted so far at just under 6,000. Contain your excitement: This is still only about .3 percent of active voters.
The Dems still have a 15 percent lead over the GOP in the very early going, but the latest batch had a slight GOP advantage over the Dems, mostly because a third of them were from dark-red Douglas County and Clark and Washoe had about 200 each. These are still VERY small numbers.
The latest statewide:

By county:

By CD:

I wouldn't read much into any of this yet, but when we look back, we will see if these were harbingers or not.
More in the AM...
UPDATED, 10/13/26, 10:30 AM
Only about 400 ballots added in the morning SOS update – here's how they break down:
| Party | New ballots | Percentage |
| Democratic | 206 | 50% |
| Republican | 89 | 22% |
| Nonpartisan | 86 | 21% |
| Other | 27 | 7% |
| Total | 408 |
The new totals:

About 5,000 ballots is still not a statistically significant sample – probably half a percent of total I expect, or less.
One interesting (maybe) note about CD2: Democrats accounted for 92 of the 143 newly accepted ballots (64 percent), compared with 24 Republicans (17 percent). And Washoe is 73 percent of the votes so far, above what it usually is.
Yes, it's still VERY early in the vote-counting. But if those trends continue, the Dems have an outside shot to reverse four and a half decades of frustration. Big IF!
In case you are curious about the county-by-county breakdown of all the votes so far:
| County | Dem | GOP | NP | Other | Total |
| Clark | 1,309 | 729 | 749 | 137 | 2,924 |
| Washoe | 729 | 318 | 309 | 69 | 1,425 |
| Douglas | 66 | 85 | 35 | 11 | 197 |
| Elko | 38 | 53 | 15 | 9 | 115 |
| Pershing | 17 | 22 | 14 | 2 | 55 |
| Humboldt | 13 | 32 | 5 | 4 | 54 |
| Mineral | 15 | 21 | 12 | 3 | 51 |
| Lyon | 17 | 16 | 6 | 5 | 44 |
| Churchill | 10 | 4 | 7 | 0 | 21 |
| Storey | 8 | 2 | 8 | 1 | 19 |
| White Pine | 3 | 9 | 0 | 3 | 15 |
| Lander | 2 | 4 | 3 | 0 | 9 |
| Lincoln | 2 | 1 | 0 | 0 | 3 |
| Eureka | 0 | 1 | 0 | 0 | 1 |
| Nye | 0 | 1 | 0 | 0 | 1 |
| Carson City | 0 | 0 | 0 | 0 | 0 |
| Esmeralda | 0 | 0 | 0 | 0 | 0 |
| Statewide | 2,229 | 1,298 | 1,163 | 244 | 4,934 |
When I get more data, you'll get more data. Let me know of any questions
UPDATED, 10/12/26, 5 PM
Good of the SOS to update the file right before the Bills game, so:
An additional 1,600 ballots added this PM, a 50 percent increase in overall ballots.
In the first sizable drop, Republicans held their own with the Dems:

The new totals:

The breakdowns you want:

More when I get it....now: GO BILLS!
UPDATED, 10/12/26, 11 AM
Five days until early voting and numbers still very small. 3,000 ballots is the number so far and not even close to 1 percent yet of all that will be cast! I do have one bonus for you, which is I calculated in CD2 what happens if Lynn Chapman is the repository of more than 5 percent because of disgust by voters with David Flippo.
First, the current numbers:
Statewide partisan breakdown
| Party | Accepted | Percentage |
| Democratic | 1,436 | 48.6% |
| Republican | 657 | 22.2% |
| Nonpartisan | 734 | 24.8% |
| Other | 128 | 4.3% |
| Total | 2,955 |
Second, here are some Chapman scenarios and how they might change the math for Teresa Benitez-Thompson to have any shot. The percentages show what TBT would need to beat Flippo under those assumptions:
| Chapman districtwide | Flippo 60% rural | Flippo 65% rural | Flippo 70% rural | Flippo 75% rural |
| 3% | 55.5% | 58.6% | 61.7% | 64.7% |
| 5% | 55.2% | 58.2% | 61.3% | 64.4% |
| 10% | 54.2% | 57.3% | 60.3% | 63.4% |
| 15% | 53.2% | 56.3% | 59.4% | 62.4% |
So if there is a big I-can't-vote-for-TBT-or-Flippo so I'll vote for the third-party candidate vote, TBT might only have to get to 55 percent or so in Washoe, which has rarely been done by a Dem but in a deep blue wave year…
More later…
UPDATED, 10/11/26, 9:55 AM
Largest number of ballots added to the SOS voter file so far, but still very small: 590 new ballots, all in Clark, with Republicans having more for the first time. But you can see, in the VERY early going, nonpartisans holding their own:
New ballots:
| Party | New accepted | Percentage |
| Democratic | 191 | 32% |
| Republican | 214 | 36% |
| Nonpartisan | 158 | 27% |
| Other | 27 | 5% |
| Total | 590 | 100% |
Statewide totals:
| Party | Accepted | Percentage |
| Dem | 1,378 | 48% |
| GOP | 638 | 22% |
| NP | 712 | 25% |
| Other | 123 | 4% |
| Total | 2,851 | 100% |
More later if I have anything, but I doubt another Sunday update is coming. It's time for real life – i.e. football!
UPDATED, 10/10/26, 10:40 AM
This is what I feel like every day:
I am not going to bother you anymore with the granular breakdown charts that say nothing until votes really start coming in. Here's where we are:
225 new accepted mail ballots in the SOS file, and the breakdown is about the same of the 2,261 in there:
| Party | Accepted | Percentage | Net change |
| Dem | 1,187 | 52% | +87 |
| GOP | 424 | 19% | +80 |
| NP | 554 | 25% | +44 |
| Other | 96 | 4% | +14 |
| Total | 2,261 | 100% | +225 |
This is still way, way under 1 percent of the total vote, but I expect the pace to pick up next week and then early voting starts a week from today.
I'll just mention one thing that may or may not mean anything: About two-thirds of the new ballots are in Congressional District 2, where the math is daunting for Dem nominee Teresa Benitez-Thompson but GOP nominee David Flippo seems to be in scandal-a-day model. and national Republicans are desperately trying to save him from his own accumulating baggage.
105 of the new ones are from the rurals and 43 are from Washoe. Here's the overall breakdown so far:

Again, this is very early and doesn't mean much, but the ultimate breakdown could be key to whether TBT has a chance. Nearly three-quarters of the CD2 ote is now from Washoe, well above the usual 62-38 breakdown favoring Washoe. Let's see what happens…
I'll keep posting whenever I get new data. Always happy to answer questions, get feedback at [email protected].
UPDATED, 10/9/26, 10:30 AM
Still slow – most Clark County voters are just getting their mail ballots – but 197 voters added to the mix this morning by SOS. I updated the charts below, but this is still only 2,000 ballots.
Remember that turnout in the last two midterms was 62 percent in 2018 and 55 percent in 2022. Keep those numbers in mind throughout this next few weeks.
If turnout is 60 percent or so, that would mean about 1.2 million voters cast ballots. And 2,000 out of 1.2 million is .16667 percent.. Try not to get excited, Dems, even though the first 2,000 votes look good for you:
| Party | Oct 9 | Percentage |
| Democratic | 1,100 | 54% |
| Republican | 344 | 17% |
| Nonpartisan | 510 | 25% |
| Other | 82 | 4% |
| TOTAL | 2036 |
Here's the breakdown by congressional district:
| CD | Dem | % | GOP | % | NP | % | Other | % | Total |
| 1 | 198 | 51% | 59 | 15% | 114 | 30% | 14 | 4% | 385 |
| 2 | 471 | 56% | 147 | 17% | 189 | 22% | 38 | 5% | 845 |
| 3 | 275 | 55% | 68 | 14% | 138 | 28% | 21 | 4% | 502 |
| 4 | 156 | 51% | 70 | 23% | 69 | 23% | 9 | 3% | 304 |
And by county:

So not much to go on, but soon we may see trends develop.
Stay tuned…I may even standardize the chart sizes eventually...
UPDATED, 10/8/26, 11:20 AM
The state has updated its voter file, still under 2,000 in all, and hardly significant in any way. But I am going to take this opportunity to show you a little bit about what you can expect to see here as votes start pouring in. In addition to what you see below, I will also soon start showing you how many votes are left statewide and in various political subdivisions and what that might mean based on various turnout scenarios.
Here are the latest numbers:
| Democratic | 1009 |
| Republican | 296 |
| Nonpartisan | 465 |
| Other | 69 |
| TOTAL | 1839 |
Here's the breakdown by congressional district:
| CD | Dem accepted | Rep accepted | NP accepted | Other accepted | Total accepted |
| 1 | 180 | 50 | 102 | 9 | 341 |
| 2 | 458 | 128 | 182 | 35 | 803 |
| 3 | 232 | 60 | 121 | 17 | 430 |
| 4 | 139 | 58 | 60 | 8 | 265 |
And by county:
| County | Dem accepted | Rep accepted | NP accepted | Other accepted | Total accepted |
| CARSON CITY | 0 | 0 | 0 | 0 | 0 |
| CHURCHILL | 9 | 3 | 6 | 0 | 18 |
| CLARK | 547 | 164 | 282 | 34 | 1027 |
| DOUGLAS | 0 | 0 | 0 | 0 | 0 |
| ELKO | 10 | 12 | 8 | 4 | 34 |
| ESMERALDA | 0 | 0 | 0 | 0 | 0 |
| EUREKA | 0 | 0 | 0 | 0 | 0 |
| HUMBOLDT | 3 | 4 | 0 | 2 | 9 |
| LANDER | 0 | 0 | 0 | 0 | 0 |
| LINCOLN | 0 | 1 | 0 | 0 | 1 |
| LYON | 11 | 7 | 5 | 2 | 25 |
| MINERAL | 4 | 3 | 1 | 0 | 8 |
| NYE | 0 | 0 | 0 | 0 | 0 |
| PERSHING | 0 | 0 | 1 | 0 | 1 |
| STOREY | 1 | 0 | 3 | 0 | 4 |
| WASHOE | 421 | 95 | 159 | 26 | 701 |
Once things really get going, I will update these charts at least once a day, sometimes more often. I just wanted to give you a glance at what I will be providing, and this is only a small sample because the major chart with votes remaining, etc. has yet to be unveiled!
As always, ping me with ideas, critiques and anything else on your mind at [email protected].
----
UPDATED., 10/7/26, 8:30 AM
Only a few more ballots have come in – 1,599 in all – so not worth talking about at all. (I also don't know why the prof has 7 in-person early ballots listed – must be a coding problem because that doesn't start for 10 days.)
While we wait, I will have some fun with charts and projections.
Today let me show you how difficult it is for Republican David Flippo, despite all of his controversies, to lose in CD2 to Democrat Teresa Benitez-Thompson. It seems obvious because it is a Trump-plus-14 district. But it's even more stark.
Here are some recent GOP performances in the rurals:
| County | Trump 2024 | Brown 2024 | Laxalt 2022 |
|---|---|---|---|
| Carson City | 54.3% | 50.0% | 52.6% |
| Churchill | 73.8% | 68.5% | 71.2% |
| Douglas | 65.4% | 62.8% | 64.8% |
| Elko | 77.2% | 71.3% | 75.2% |
| Esmeralda | 81.6% | 75.3% | 75.8% |
| Eureka | 87.8% | 80.9% | 85.9% |
| Humboldt | 76.5% | 69.0% | 72.9% |
| Lander | 80.0% | 71.0% | 75.6% |
| Lincoln | 85.3% | 79.8% | 80.1% |
| Lyon | 71.1% | 65.8% | 69.0% |
| Mineral | 66.6% | 58.0% | 59.3% |
| Nye | 70.2% | 64.2% | 66.4% |
| Pershing | 76.4% | 70.6% | 71.6% |
| Storey | 68.6% | 64.2% | 67.5% |
| White Pine | 77.3% | 72.9% | 74.7% |
Remember IAP hopefrul Lynn Chapman, who got 5 percent in 2024 when she ran, is also on the ballot. I assume she will get about the same, but maybe she will be a repository for "none of the above" voters looking to register a protest?
Here's what TBT would need to get in Washoe -- the headers show what percentage of the vote Washoe might be and the columns show what she would need under various scenarios:
Chapman at 5%
| Flippo rural | Washoe 60% | Washoe 62% | Washoe 65% | Washoe 68% |
|---|---|---|---|---|
| 60% | 55.8% | 55.2% | 54.2% | 53.4% |
| 65% | 59.2% | 58.2% | 56.9% | 55.7% |
| 70% | 62.5% | 61.3% | 59.6% | 58.1% |
| 75% | 65.8% | 64.4% | 62.3% | 60.4% |
How unprecedented would it be for TBT to get above 55 percent?
Both Dem senators were at about 50 percent in Washoe during the previous two cycles. Barack Obama got 55 percent in the Dem wave year of 2008. You have to find races where the GOP opponent was quite bad – worse than Flippo? – to find Aaron Ford getting 55 percent against Sigal Chattah in 2022. Now, CCM got 65 percent in Washoe against sacrificial lamb Don Chariez in the 2010 AG race, but that is an outlier.
Nevada is purple; Washoe is purple, although Dems have run well there in recent cycles.
So TBT would need either a very unlikely performance in Washoe at 60 percent or so, Washoe would have to be a significantly larger percentage of the vote than usual or rural turnout/margins would have to be down to have any chance. And even under any or all of the scenarios, it is likely to be close. Tribalism in the rurals is just so strong.
Flippo remains the favorite despite being such a terribly flawed candidate. It's hard to see the math working for TBT, but we will know more when votes really start coming in.
(Thanks, as always, for some AI help with the chart calculations.)
----
Welcome to the early voting blog!
For those who have been with me for previous versions, welcome back!
For those of you who have not, you are in for a treat if you care about actual data and not so much about polls. Here is what I did in 2024 and 2022.
I am trying to make this better every cycle, and ChatGPT has been a big help in refining my model this year. There will be something in here for everyone, whether you are interested in the marquee race for governor or congressional races or legislative contests.
I am not ashamed of seeking help along the way, so if you have information to impart or advice to give or corrections to make, email me at [email protected].
There is not much to go on yet – not many ballots are in. But I want to frame the discussion and show you some historical baselines before the deluge of mail ballots begins, perhaps as early as later this week.
Let me tell you what this is and what it isn't:
This blog is about who is voting, not whom they are voting for. But partisan turnout patterns can tell us plenty about the electorate taking shape.
I'll start with several assumptions, including that roughly 90 percent of Democrats and Republicans will support their respective parties' candidates. I'll also show what happens when those assumptions change.
One of the numbers I'll be watching most closely is the Republican turnout advantage. I'll initially model scenarios ranging from R+1 to R+5 percentage points, adjusting as the actual returns come in.
And I'll keep asking the question that matters more with each passing day: Given who has already voted, what would have to happen among everyone who hasn't?
In the past, with huge Clark County firewalls for the Dems — the number of votes they had banked — I was even able to declare outcomes before Election Day. Those days are gone because of diminished Dem registration advantages in Clark County, which houses Las Vegas and has nearly 73 percent of active voters.
But I can still discern trends, as I did in 2024 with GOP turnout. My ultimate prediction in my Indy column — that Kamala Harris would eke out a victory — turned out to be wrong, although I correctly called the other five federal races.
But this blog is not about predictions; it is about raw data. And I will give you a lot of it. Think of it as a buffet: You can choose what you want to feast on.
Before the ballots start pouring in, let's establish four historical benchmarks.
First, how Nevadans vote has changed dramatically. Mail ballots now account for roughly half the vote — every voter has been mailed a ballot since COVID — and most ballots are cast before Election Day.
Second, Republican turnout has generally exceeded Democratic turnout in recent midterms. How large that gap becomes this year will be one of the numbers I watch most closely.
Third, geography matters. Clark County contains nearly three-quarters of Nevada's active voters, but turnout there has historically lagged Washoe and far behind rural Nevada. The relative turnout in those three areas can substantially change the composition of the statewide electorate.
Fourth, voters who aren't registered with either major party will be an enormous part of this election. We know how many of them vote. We don't know whom they support. That's where the assumptions — and the math — become particularly interesting.
So now we are ready for the votes to start coming in.
Here is the electorate we start with, as of Oct. 1 from the SOS:
Only about 1,500 ballots have been cast so far. Michael McDonald, the professor not the chairman of the NV GOP — is a great source of information. I expect the mail ballot number to start steadily increasing very soon.
What I'll be watching every day
There are several numbers I care about more than the raw statewide D-versus-R ballot count.
Turnout. What percentage of registered Democrats have voted? Republicans? Non major-party voters?
The turnout gap. If Republicans are turning out at 4 percentage points more than Democrats, that means something very different from an R+8 turnout advantage — regardless of the raw ballot margin.
Geography. How much of the vote is coming from Clark? Washoe? The rurals? Are those places producing the electorate we would normally expect?
For a baseline, just under 73 percent of active voters reside in Clark County, just under 16 percent are in Washoe and just under 12 percent are in rural Nevada. The higher rural turnout is relative to Clark and Washoe, the more those quarter-million voters can affect the composition of the statewide electorate. If it's smaller than expected …
What has to happen?
I'll also keep a running set of turnout scenarios, from R+5 to Even. Those numbers refer to the difference between Republican and Democratic turnout rates — not the partisan margin in ballots or votes.
As more ballots come in, I'll calculate what would have to happen among the remaining electorate under different assumptions about partisan loyalty and non-major-party voters. At first, those scenarios will be mostly hypothetical. But as hundreds of thousands of Nevadans vote, the assumptions will matter less and the composition of the actual electorate will matter more. That's when this gets really interesting.
A special CD2 watch
I'm also going to spend more time on the 2nd Congressional District this year because it may be more competitive than it has been in a long time. I'll particularly focus on its two very different components: Washoe and rural Nevada. Based on the registration snapshot we've been working with, approximately 62 percent of CD2's registered voters are in the Washoe portion and 38 percent are in the rural portion.
The interesting mathematical question is straightforward.
If a Democratic candidate receives X percent in the rural portion, what percentage would that candidate need in the Washoe portion to reach 50 percent or thereabouts (there is a third-party candidate) districtwide?
And vice versa.
Again, that's not a prediction. It's math. As I will show you, the district is so Republican and rural Nevada usually votes so red that a Dem might need to get to 60 percent in Washoe (quite unlikely but not impossible) to win under normal conditions.
Get ready for updates, and I like to say, as Bette did (but for weeks and, I hope, not months!):
It was not just lip service earlier: If you have questions, suggestions, criticisms, corrections (I will make mistakes!) or, heaven forfend, kudos, please email me.
Onward!
Article at a Glance
- Publisher
- The Nevada Independent
- Author
- Jon Ralston
- Primary topic
- Elections
- Coverage
- Local Net, Nevada, US
- Published
- Oct 6, 2026 · 3:32 PM
About the Publisher
Your State. Your News. Your Voice.
Coverage
This report is associated with Local Net, Nevada, US based on the location metadata supplied with the story or publisher profile.
Topics & Keywords
Primary topic: Elections
Related topics: Elections, Local Net, Nevada, Local News
Frequently Asked Questions
Who published this report?
This report was published by The Nevada Independent and credits Jon Ralston as the author.
What is the primary topic?
The story is categorized as Elections in the Newswire metadata.
What area does this story cover?
The available Newswire metadata associates this report with Local Net, Nevada, US.
What do you think about this story?
Share your perspective and join the conversation with other readers.
Discussion is hosted by Las Vegas Newswire. Publisher attribution and the originating report remain unchanged.
About Las Vegas News Publisher Network
Las Vegas News Publisher Network is the publisher-distribution network operated by Las Vegas News. It organizes reporting from participating publishers while preserving publisher attribution and links to the original source.

As Nevada's 24-hour economy grows, working parents struggle to find overnight childcare
The number of Nevada facilities offering 24-hour care has fallen by about half since 2018, from 71 to 35. Of the 35 facilities still offering for round-the-clock care,…
 Election 2026
'Halo guy' Marty O'Donnell wants to flip a Vegas House seat. Can he convince voters IRL?
The Nevada Independent→
Election 2026
'Halo guy' Marty O'Donnell wants to flip a Vegas House seat. Can he convince voters IRL?
The Nevada Independent→
 Opinion
OPINION: Why is this 2017 Las Vegas sexual assault case taking so long to come to trial?
The Nevada Independent→
Opinion
OPINION: Why is this 2017 Las Vegas sexual assault case taking so long to come to trial?
The Nevada Independent→
 Business
SOAK Nail Spa and Lounge celebrates 20 years in business
This Is Reno→
The Nevada Independent2 followersVerified
Business
SOAK Nail Spa and Lounge celebrates 20 years in business
This Is Reno→
The Nevada Independent2 followersVerified Stay connected and personalize your Newswire experience.
Loading recommendations…